A weekly social media report is a one-page summary of what you posted, how people responded and what you will do next. The steps below show what to include, where to find the numbers and how to read them without overreacting, with a template you can copy into any spreadsheet or document.
What is a weekly social media report for?
A report answers one question: what is worth repeating? Looking at the numbers once a week, in the same format, shows patterns that a single day hides. It also keeps the plan honest, because next week's posts start from what actually happened.
What should the report include?
Keep it to one page. These sections are enough for most small businesses.
- What was posted: the number of posts on each channel.
- How people responded: reactions, comments, shares, saves and link clicks, as each channel reports them.
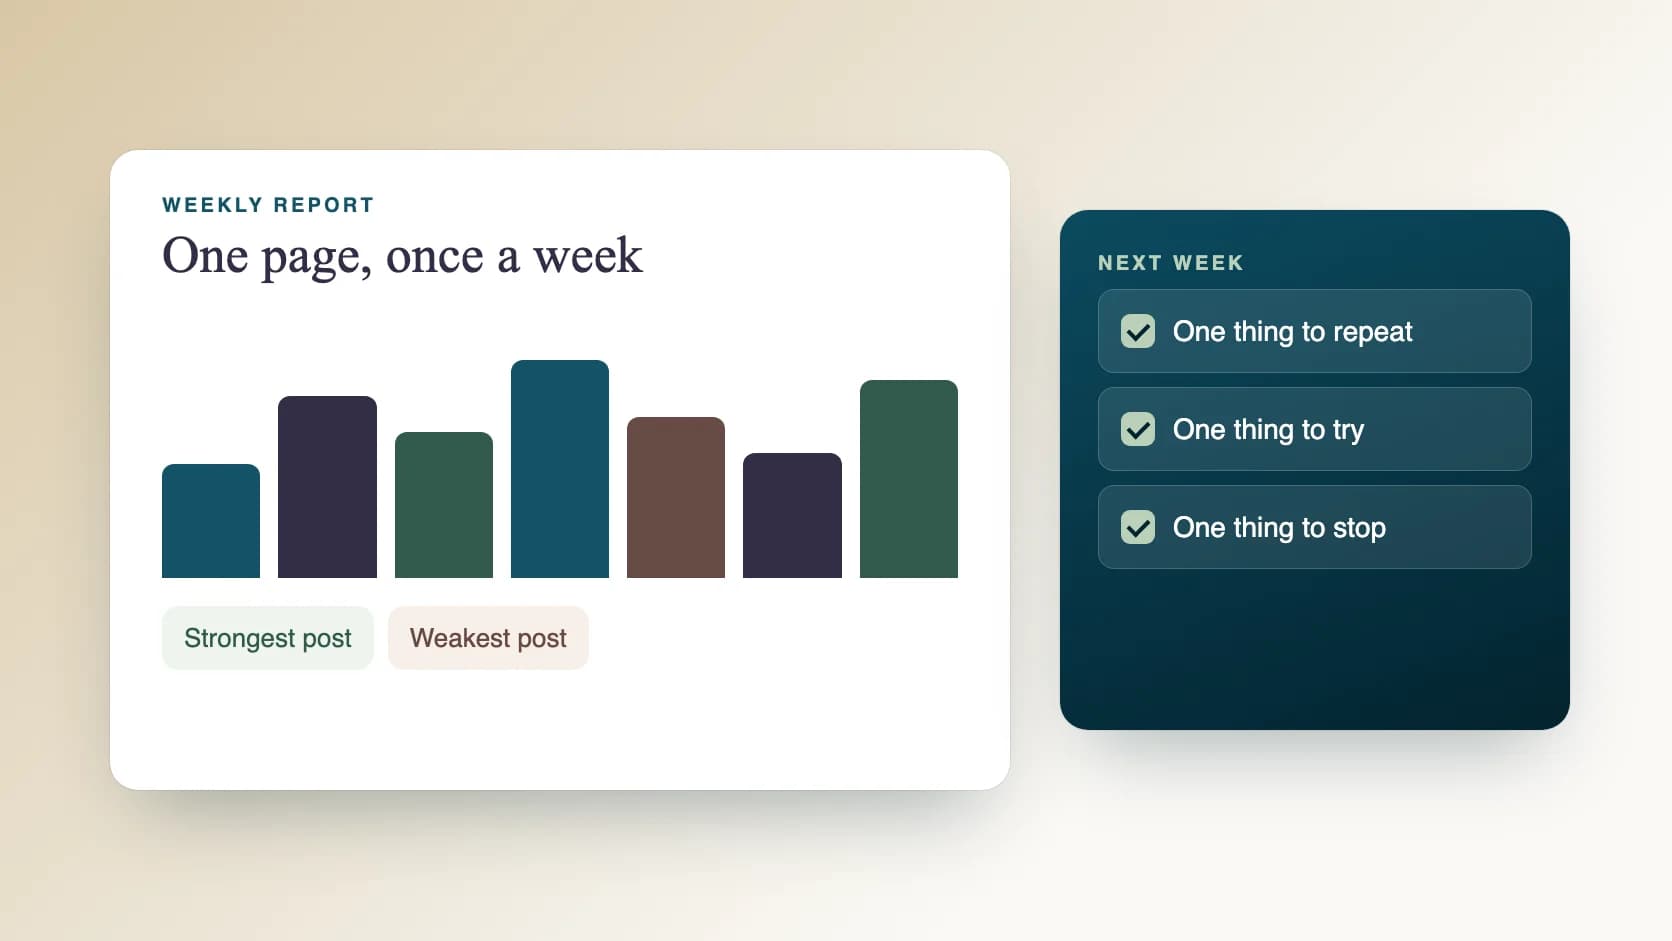
- Strongest and weakest posts: the top and bottom of the week.
- Comments and messages handled, and any that need a decision.
- One lesson from the week, in a sentence.
- The plan for next week, adjusted from what you learned.
Where do the numbers come from?
Use the analytics built into each channel. Copy the figures into one sheet each week so you can see them side by side. Use the same measures every week and note the date range. Numbers from different channels are not directly comparable, so compare each channel with its own earlier weeks.
What does the template look like?
Copy these headings into a document and fill them in once a week.
- Week of: the dates covered.
- Channels covered.
- Posts published: count and a list of titles.
- Response: the measures you track, per channel.
- Strongest post and why you think it worked.
- Weakest post and why you think it did not.
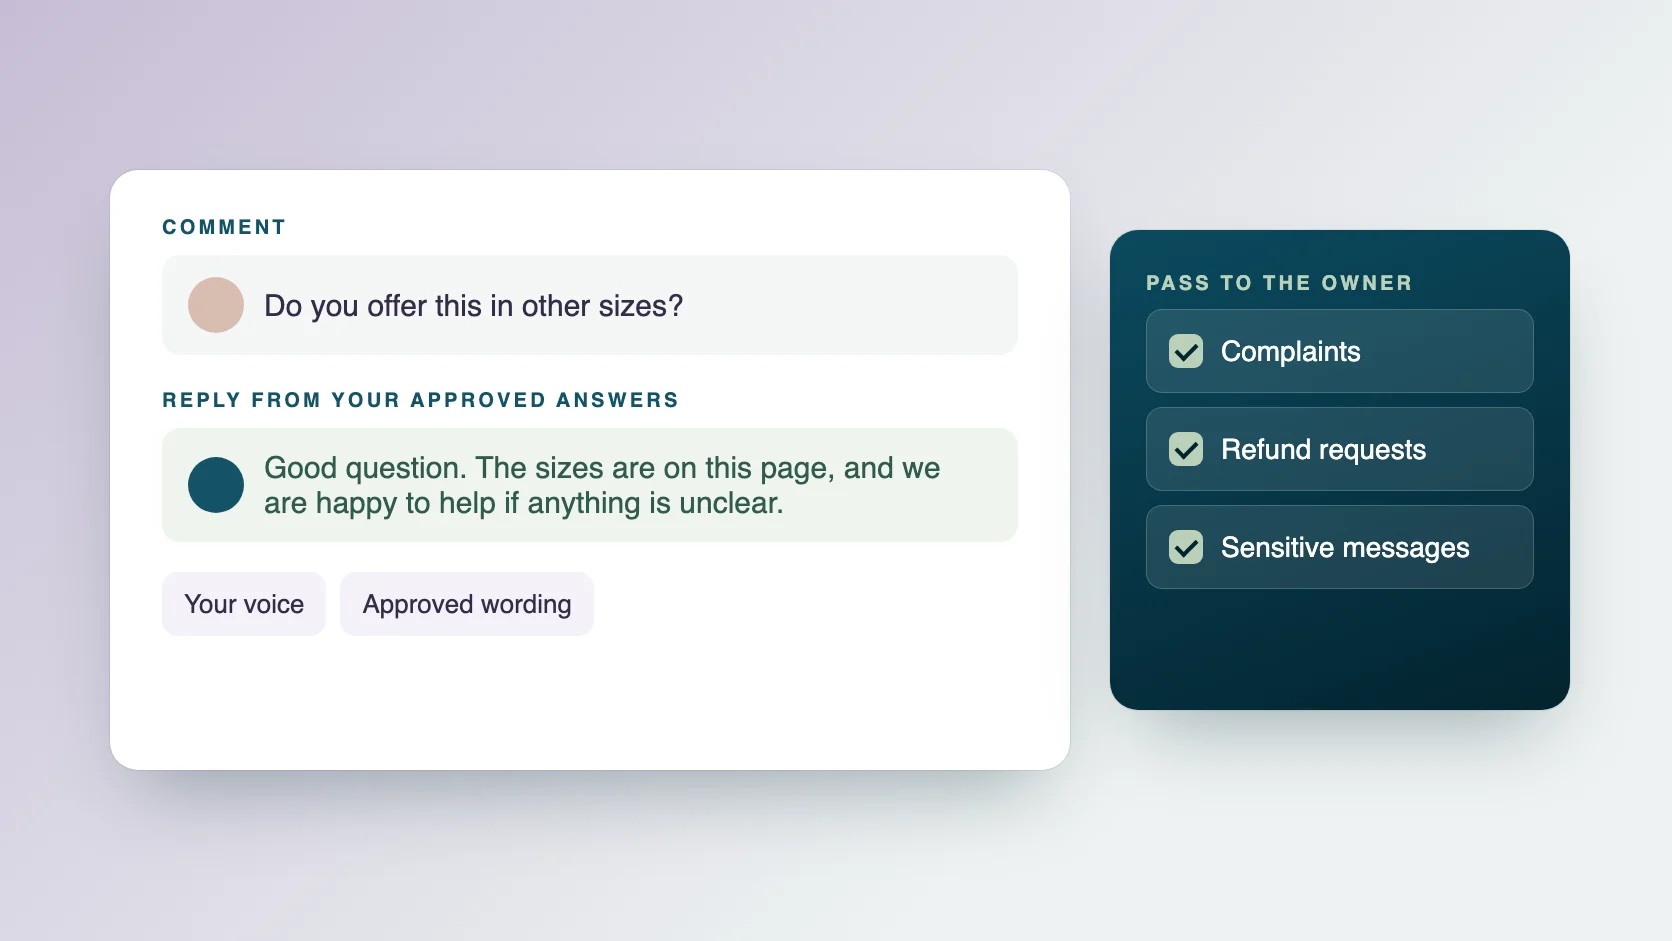
- Comments and messages: handled, waiting, passed to the owner.
- Lesson of the week.
- Plan for next week.
How do you read the numbers without overreacting?
One week is a small sample. A single post that did very well or very badly may reflect timing or chance as much as quality. Look for patterns over several weeks before you change your approach, and be cautious about drawing conclusions from small differences. If a figure looks odd, check it against the channel before you act on it.
How do you learn from the strongest and weakest posts?
Ask the same questions of each.
- What was the topic?
- What was the format: image, video, text or link?
- What was the first line?
- When was it posted?
- Was it a question, a tip, an offer or news?
How do you turn the report into next week's plan?
Write down one thing to do more of, one thing to try and one thing to stop. Then open your weekly post plan and adjust the themes and formats accordingly. The report is useful only if it changes what you do next.
What mistakes should you avoid?
Most weekly reports go wrong in the same ways.
- Tracking too many measures, so nobody reads the report.
- Changing the format every week, which makes weeks hard to compare.
- Treating one post as proof of a trend.
- Comparing different channels as if they used the same measures.
- Writing the report and not acting on it.
What can an assistant take off your plate?
Gathering figures and writing the summary is a repeat task that suits delegation. With social media reporting at Ragiles, an assistant collects your figures into one sheet, writes a short weekly summary, flags the strongest and weakest posts and adjusts next week's plan from the numbers. Every figure is checked against its source, every AI draft is checked by a person, and no growth or results are promised. Prices start at $5 an hour, with no onboarding fee.
Common questions
Which numbers matter most? Choose the few that match your goal, such as replies for conversation or link clicks for traffic, and track them consistently.
How long should the report be? One page. If it is longer, people stop reading it.
Should I report weekly or monthly? Weekly for decisions, with a monthly roll-up for the bigger picture.
Can I build the report in a spreadsheet? Yes. A simple sheet with one row per week works well.
Can AI write the summary? AI can draft a summary from your figures. A person should check every figure against the source before the report is used.